How to Prove Marketing ROI: 11 Metrics Your CFO Will Trust
Only 52% of senior marketing leaders say they can prove marketing’s value and get credit for it, according to a Gartner survey of 378 marketing leaders (Gartner). The same survey found CFOs are the executives most skeptical of marketing’s value (40%), just ahead of CEOs (39%).
That’s the gap this guide closes. To prove marketing ROI, you don’t need more dashboards. You need fewer, harder numbers in the language finance already uses: pipeline, payback, cost to acquire and the value of what you acquired. Here are the 11 metrics that do that, how to calculate each one, and the one-page report that gets them read.
If you want content-level metrics (traffic, rankings, engagement), see SaaS content marketing metrics that actually matter. This guide is about the whole marketing budget.
Why marketing keeps losing the budget argument
The money is tight, and everyone at the table knows it.
- Budgets are flat. Gartner’s 2025 CMO Spend Survey of 402 marketing leaders found budgets stuck at 7.7% of company revenue, with 59% of CMOs saying that isn’t enough to execute their strategy (Gartner).
- Cuts are planned. In the same survey, 39% of CMOs planned to reduce agency budgets and 39% planned to cut labor costs.
- Results are the job. In a separate Gartner survey of 125 CEOs and CFOs, 69% named failing to deliver promised results as the top reason they’d remove a CMO. Only 54% were confident their CMO could prove marketing’s value.
- Attribution is hard. In CMI’s B2B research, 56% of marketers said they struggle to attribute ROI to their content (CMI).
When the proof is weak, marketing gets treated as an expense. In Gartner’s 2024 research, 47% of CMOs said that’s exactly how their company sees it. And when budgets are cut, it’s usually the long-term demand generation work that goes first, because it’s the hardest to defend.
Speak finance, not marketing
Most ROI reports fail because they answer a question finance never asked. Translate before you present.
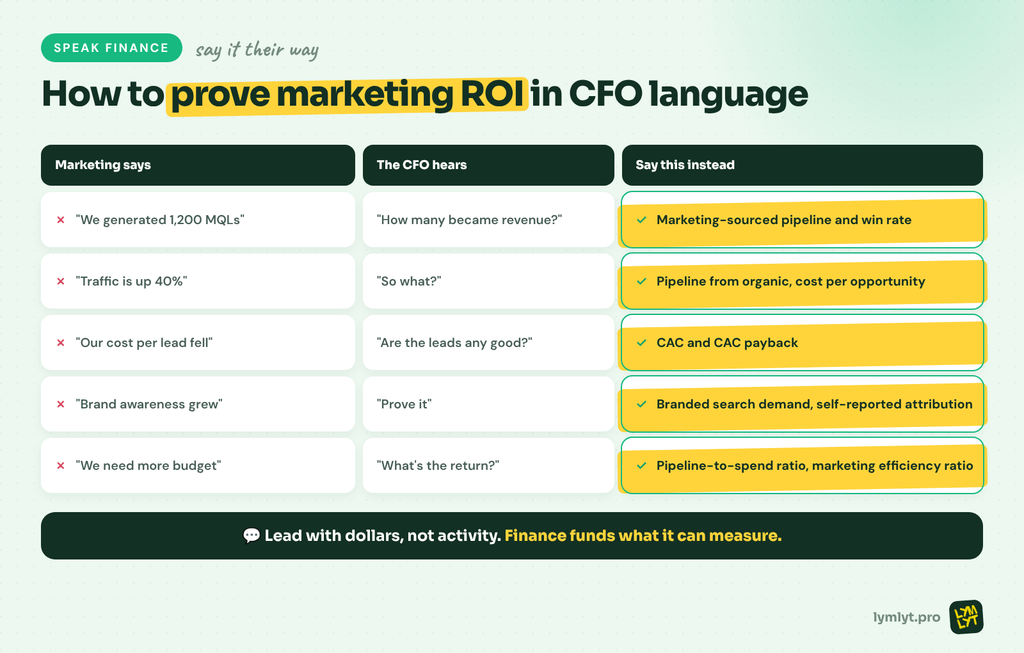
| Marketing says | The CFO hears | Say this instead |
|---|---|---|
| “We generated 1,200 MQLs” | “How many became revenue?” | Marketing-sourced pipeline and win rate |
| “Traffic is up 40%” | “So what?” | Pipeline from organic, and cost per opportunity |
| “Our cost per lead fell” | “Are the leads any good?” | CAC and CAC payback |
| “Brand awareness grew” | “Prove it” | Branded search demand and self-reported attribution |
| “We need more budget” | “What’s the return?” | Pipeline-to-spend ratio and marketing efficiency ratio |
Gartner’s research backs the shift. Marketing leaders who use two or more types of high-complexity metrics, such as LTV, CAC and LTV:CAC or return metrics like ROI, were up to 1.8 times more likely to prove marketing’s value than those who use none.
The 11 metrics that prove marketing ROI
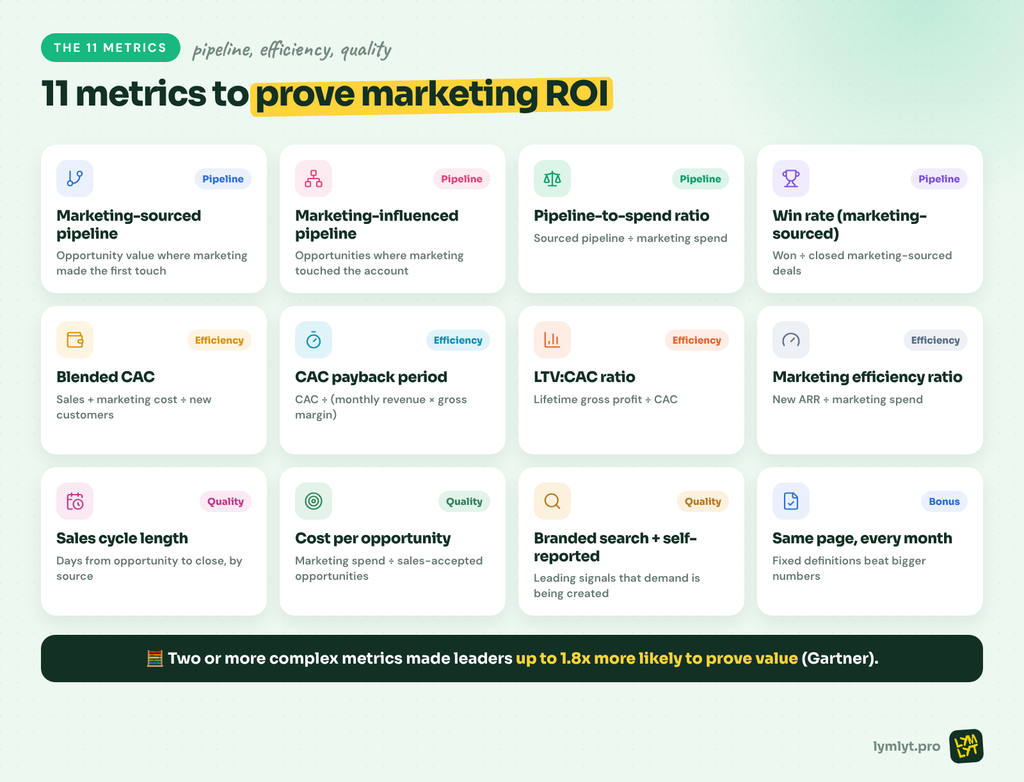
They fall into three groups. Pipeline metrics show what marketing creates. Efficiency metrics show what it costs. Quality metrics show whether it lasts.
Pipeline: what marketing creates
1. Marketing-sourced pipeline. The total value of opportunities where marketing created the first touch. Formula: sum of opportunity value where the original source is a marketing channel. Why finance trusts it: it’s a dollar figure tied to deals sales has accepted, not a lead count. Watch out: agree the source rules with sales before the quarter starts, not after.
2. Marketing-influenced pipeline. Opportunities where marketing touched any contact on the account before or during the deal. See our definition of pipeline influenced. Why it matters: B2B deals involve many people. Forrester found the average buying decision involves 13 people, and 89% of purchases involve two or more departments (Forrester). Sourced alone undercounts marketing. Watch out: never add sourced and influenced together. Influenced includes sourced.
3. Pipeline-to-spend ratio. Pipeline generated for every dollar marketing spends. Formula: marketing-sourced pipeline ÷ marketing spend in the same period. Why finance trusts it: it’s the closest thing to a return figure before revenue closes.
4. Win rate on marketing-sourced opportunities. The share of marketing-sourced opportunities that close as won. Formula: won marketing-sourced opportunities ÷ all closed marketing-sourced opportunities. Why it matters: it answers “are the leads any good?” If your win rate on marketing deals trails other sources, the pipeline number is inflated. Our guide on why more MQLs can still mean less pipeline covers the usual cause.
Efficiency: what it costs
5. Blended CAC. What it costs to win one new customer. Formula: total sales and marketing cost ÷ new customers won in the period. Why finance trusts it: CFOs already use it. Report paid CAC separately if paid media is a big line. For what content itself should cost, see how much content marketing costs for B2B SaaS.
6. CAC payback period. How many months of gross margin it takes to earn back the cost of acquiring a customer. Formula: CAC ÷ (monthly recurring revenue per new customer × gross margin %). Why finance trusts it: it’s a cash metric. A shorter payback means growth funds itself sooner. Ask finance what payback they consider healthy for your model, then report against that number.
7. LTV:CAC ratio. The lifetime value of a customer compared with what it cost to win them. Formula: (average revenue per customer × gross margin % × average customer lifetime) ÷ CAC. Why finance trusts it: it shows whether you’re buying customers worth having. Many SaaS teams treat 3:1 as the rule of thumb, but agree the target with finance.
8. Marketing efficiency ratio. New annual recurring revenue for every dollar of marketing spend. Formula: new ARR in the period ÷ marketing spend in the period. Why it matters: it rolls the whole program into one number a board understands. If you’re setting the budget behind it, our guide for $5M ARR founders on budgeting for content shows how to size the content line.
Quality: whether it lasts
9. Sales cycle length. Days from opportunity creation to close, split by source. Why it matters: good content and comparison pages shorten deals. If marketing-sourced deals close faster, that’s cash sooner. Our guide to B2B SaaS comparison pages shows how late-stage pages do this.
10. Cost per opportunity. Marketing spend divided by sales-accepted opportunities, not leads. Why finance trusts it: cost per lead rewards volume. Cost per opportunity rewards quality, and it can’t be gamed with cheap downloads. If traffic isn’t turning into opportunities, start with why your B2B SaaS content isn’t converting.
11. Branded search demand and self-reported attribution. Leading indicators that brand and content are creating demand. How to measure: track branded search volume over time, and add an open “How did you hear about us?” field to every demo form. Why it matters: much B2B buying happens where your CRM can’t see it. Our piece on the recommendation that never appears in your CRM explains why the answers buyers type are often the best attribution data you have.
Which metric answers which question
| The CFO asks | Lead with |
|---|---|
| “What did we get for the money?” | Pipeline-to-spend ratio, marketing efficiency ratio |
| “Are we buying good customers?” | LTV:CAC, win rate |
| “When do we get the cash back?” | CAC payback period |
| “Is brand spend working?” | Branded search demand, self-reported attribution |
| “Can we cut this channel?” | Cost per opportunity by channel |
The one-page ROI report your CFO will read
Long decks get skimmed. Give finance one page, the same every month, with the same definitions.
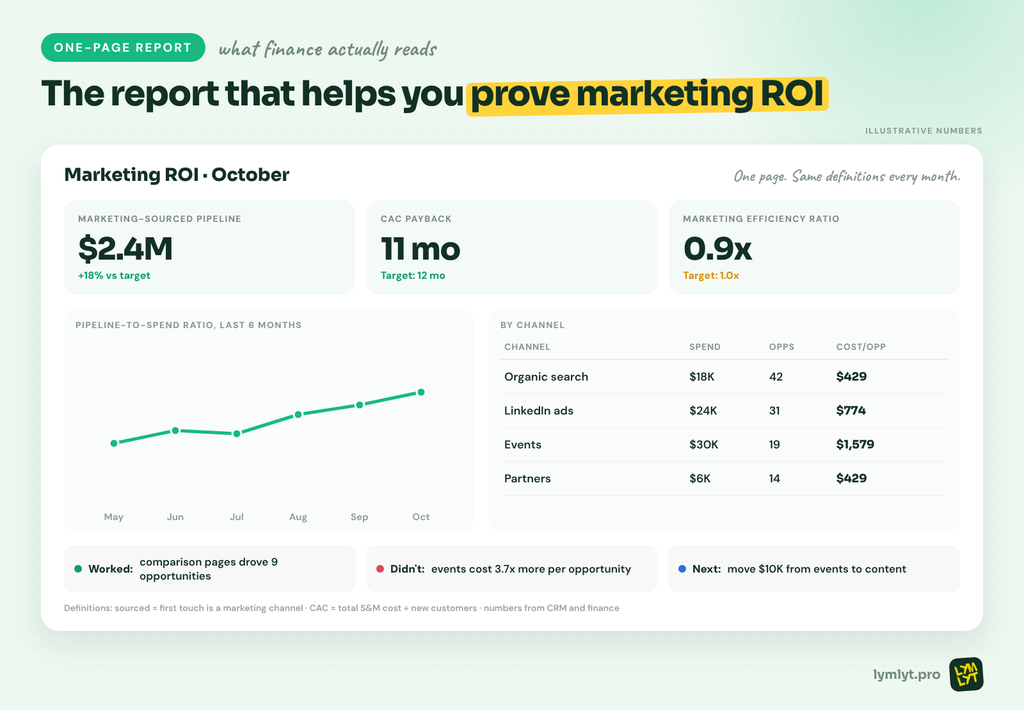
Put these on it:
- Three headline numbers: marketing-sourced pipeline, CAC payback period and marketing efficiency ratio, each against target.
- Trend: the last six months of pipeline-to-spend ratio.
- Channel table: spend, opportunities and cost per opportunity by channel.
- Three lines of commentary: what worked, what didn’t, what you’ll change next month.
- Definitions footnote: how each metric is calculated, so nobody argues about the formula in the meeting.
Run every number from the CRM and finance systems, not a marketing tool. If nobody owns that plumbing, a marketing operations agency can set it up. If you need software to connect the data, our list of the best B2B marketing attribution tools compares the options.
What to report, and when
Some metrics move monthly. Others only mean something over a quarter or a year. Mixing them up is how good programs get cut too early.
| Cadence | Metrics |
|---|---|
| Monthly | Marketing-sourced pipeline, cost per opportunity, branded search demand |
| Quarterly | Pipeline-to-spend ratio, win rate, sales cycle length, CAC |
| Annually | CAC payback, LTV:CAC, marketing efficiency ratio |
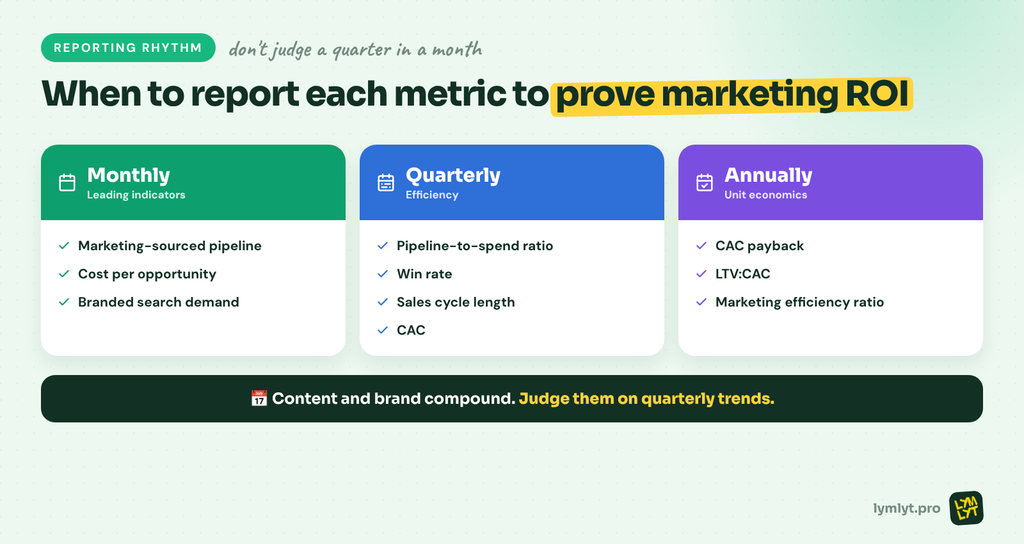
Content and brand compound. Judge them on quarterly trends, not one month’s dip. HubSpot is the cautionary tale: it lost most of its blog traffic while revenue rose 19%, which shows how misleading a single traffic metric can be.
Pair the numbers with the buyer’s voice. Our guide to win-loss analysis shows how to find out why deals were really won or lost, which explains the metrics better than any dashboard.
5 mistakes that kill marketing’s credibility
- Reporting MQLs as proof. A lead count isn’t a business result. Lead with pipeline.
- Double counting. Adding sourced and influenced pipeline together inflates the total and loses finance’s trust in one meeting.
- Last-touch only. It hands all the credit to the final click and starves the channels that created demand. See our attribution definition for the models.
- Different time windows. Comparing this month’s spend with next quarter’s revenue makes every number argue with every other number. Fix the windows in the definitions footnote.
- Ignoring AI search. Buyers now shortlist vendors inside AI answers. If you invest there, report it honestly; our take on why your AI visibility ROI number is mostly a guess shows what to report instead.
Frequently asked questions
What is a good marketing ROI?
There’s no universal number, because it depends on your margins, deal size and sales cycle. Agree targets with finance for pipeline-to-spend, CAC payback and LTV:CAC, then report against those. Your own trend matters more than an industry benchmark.
How do you prove ROI for brand and content?
Use leading indicators that finance can see moving: branded search demand, self-reported attribution and marketing-influenced pipeline. Then show the lagging result over two or three quarters. For content specifically, our guide to content ROI covers the formula.
How long before marketing ROI shows up?
Paid channels can show pipeline in weeks. Buyers also research long before they convert, as our guide to the B2B buying journey shows. Content and SEO usually take several months to show in pipeline, and longer to show in CAC payback. Set expectations up front and report leading indicators until the lagging ones catch up.
The bottom line
To prove marketing ROI, stop reporting activity and start reporting finance. Pick the metrics that answer the CFO’s questions, define them once, and show the same one page every month. Credibility comes from consistency, not from the size of the number.
If your pipeline depends on content that isn’t pulling its weight, start with the basics: know exactly who you’re selling to, build for the whole buying committee, and see how demand generation and demand capture split your budget. Or let LymLyt build the SEO content engine behind the numbers: see our pricing, from $1,499/month.

Jay is the co-founder of LymLyt and an AI partnership consultant helping B2B SaaS companies grow through content strategy, SEO, and AI integration. He writes about content marketing, what makes B2B content convert, and how SaaS teams can build content systems that drive real pipeline.