Your AI visibility ROI number is mostly a guess. Here is what to report instead.
Every CMO I have spoken to this quarter has asked some version of the same question. We are paying for AI visibility work. What is it returning?
It is a fair question. It is also, right now, close to unanswerable with the tools most teams have.
I have spent eight years in B2B SaaS content, and the last two of those watching AI search go from a curiosity to a line item. I run LymLyt, where we build organic content programs for B2B SaaS companies. AI visibility is one of the services we sell, so I have an obvious reason to want a clean ROI number. I do not have one. Neither does anyone else selling this.
What I do have is a way to report on the work that holds up when a CFO pushes back. That is what this post is about.
The numbers everyone is quoting
Search for AI traffic conversion rates and you will find a wide spread of figures. Here is where the commonly cited ones actually come from.
| Claim | Source | What it is based on |
|---|---|---|
| AI visitors convert 23x better | Ahrefs | Ahrefs’ own website, 30 days of data. One company. |
| 14.2% vs 2.8% conversion, roughly 5x | Opollo 2026 benchmark | 312 B2B tech firms, Jan 2025 to Jan 2026 |
| AI traffic converts 42% better | Adobe, March 2026 | US retail sites on Adobe’s platform |
| 4 to 6x higher than organic | Various agency blogs | No named sample, no methodology |
Look at the spread. 42% and 2,200% are both being sold as “the” conversion premium. They cannot both describe your business.
Two things explain most of the gap. The Adobe number is retail. Retail conversion is a same-session purchase. B2B SaaS conversion is a form fill that turns into a deal four months later. Those are different events and they respond to AI referral differently.
The Adobe figure carries a second warning that rarely gets quoted alongside it. Twelve months earlier, visitors arriving at US retailers from AI assistants converted at roughly half the rate of visitors from other channels. The multiple did not just grow. It flipped sign inside a year.
So even the best-sourced number in this table describes a moving target. Building a budget case on it is building on a number that was the opposite of itself four quarters ago.
The second explanation matters more.
The 23x number is one company’s analytics
The Ahrefs figure is the one that gets screenshotted. It is worth reading past the headline.
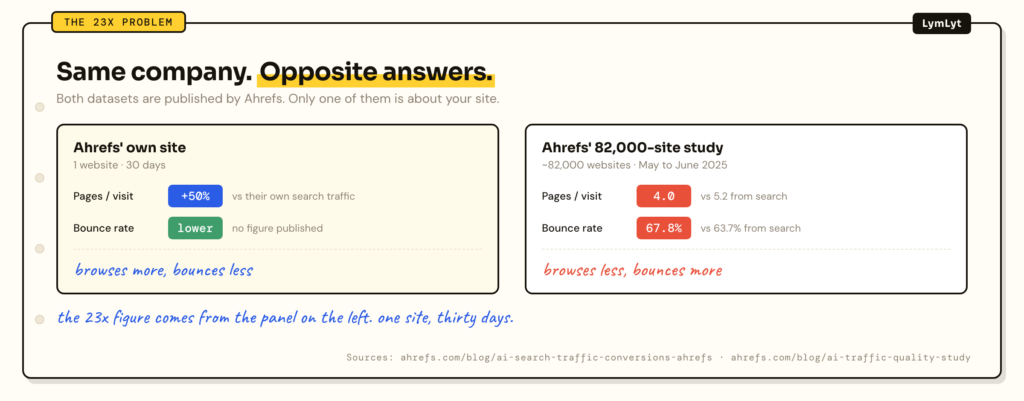
Ahrefs reported that AI search sent 0.5% of their traffic over 30 days and produced 12.1% of signups. That is where 23x comes from. The author, Patrick Stox, added his own caveats in the same post: this “might be somewhat unique to us,” he was not sure it would scale, and a larger multi-site study was in progress.
That larger study exists. Ahrefs analysed roughly 82,000 websites across May and June 2025 and found the opposite pattern on engagement.
| Metric | AI visitors | Search visitors |
|---|---|---|
| Pages per visit | 4.0 | 5.2 |
| Bounce rate | 67.8% | 63.7% |
| Time on site | 86 seconds | 78 seconds |
So the same company published a single-site result showing AI visitors browse more and bounce less, and an 82,000-site study showing they browse less and bounce more.
Both can be true. Ahrefs sells a product that people arrive ready to buy, with free tools and a pricing page that AI assistants send people straight to. That is a specific shape of business. Most B2B SaaS companies do not have it.
The practical takeaway: a conversion multiple measured on someone else’s site tells you nothing about yours. If you put 23x in a board deck, you are quoting Ahrefs’ funnel, not your own.
The standard ROI model, and what it assumes
Semrush published the clearest version of the model I have seen. For B2B it runs like this:
AI visits × lead rate × qualified-lead rate × close rate × ACV = revenue
revenue × gross margin = gross profit
(gross profit − costs) ÷ costs × 100 = ROI
Their worked example:
| Step | Value |
|---|---|
| AI-attributed visits | 1,000 |
| Lead rate 4% | 40 leads |
| Qualified rate 30% | 12 qualified leads |
| Close rate 20% | 2.4 deals |
| ACV $6,000 | $14,400 revenue |
| Gross margin 80% | $11,520 gross profit |
| Monthly cost $4,000 | 188% ROI |
The arithmetic is fine. Every number after the first one is probably fine too, because you already know your lead rate, close rate and ACV from your CRM.
The problem is the first line. Everything in that table is multiplied by “AI-attributed visits.” If that input is wrong, the ROI number inherits the error and then amplifies it.
That input is wrong for most companies right now. Here is why.
Where the model breaks
1. Your analytics cannot see most AI traffic
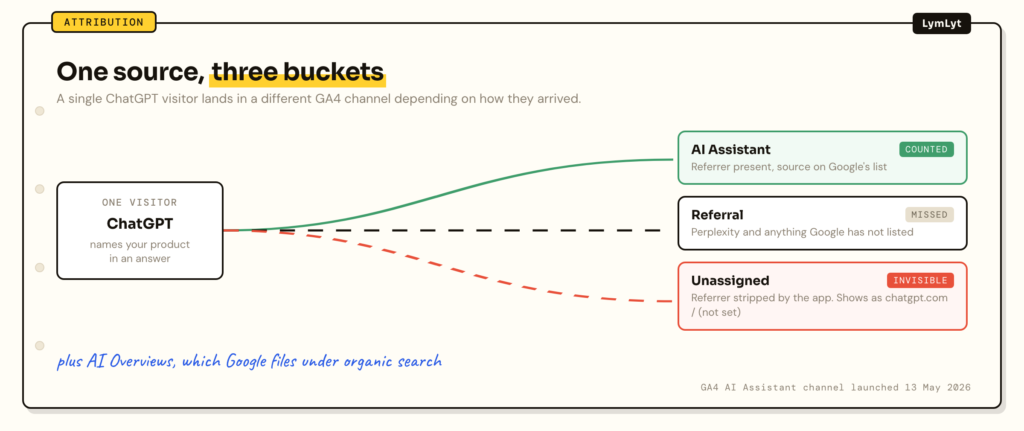
Google added a native AI Assistant channel to GA4 on 13 May 2026. It helps. It does not solve the problem.
The channel only fires when the referrer header is present and the source is on Google’s list. That leaves several gaps:
- Perplexity is not on the list. Those sessions stay in Referral.
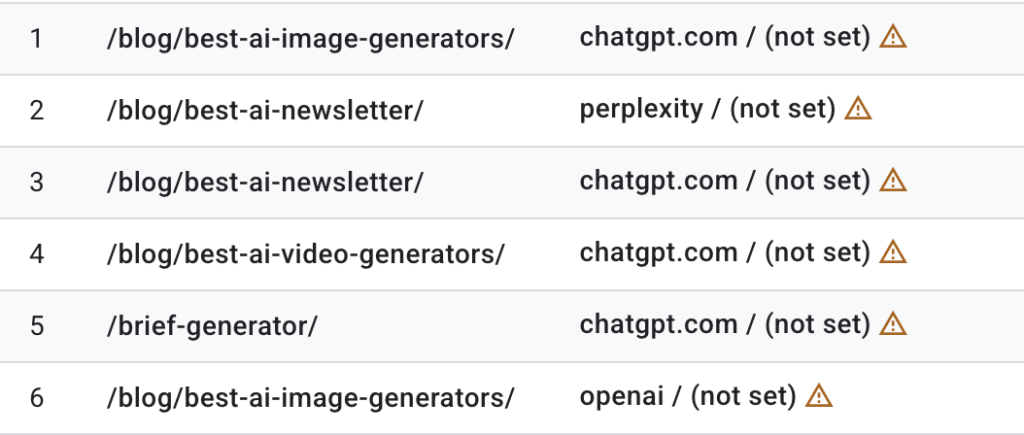
- Stripped referrers land in Unassigned. A tap inside the ChatGPT mobile app often passes nothing. Those sessions show up as
chatgpt.com / (not set)in a bucket most teams never open.
- AI Overviews and Google AI Mode are deliberately counted as organic search. Google does not separate them.
- Copy-paste is invisible. Someone reads your name in an answer, types your brand into a browser, and lands as Direct.
Search Engine Journal’s breakdown of the channel puts it well: a single source like chatgpt.com ends up smeared across three channels at once.
So when you type 1,000 into that model, you are typing a number that is missing an unknown fraction of the real total. Not a fixed 30%. An unknown fraction, which changes as AI apps change their referrer behaviour.
2. Most of the influence never produces a click at all
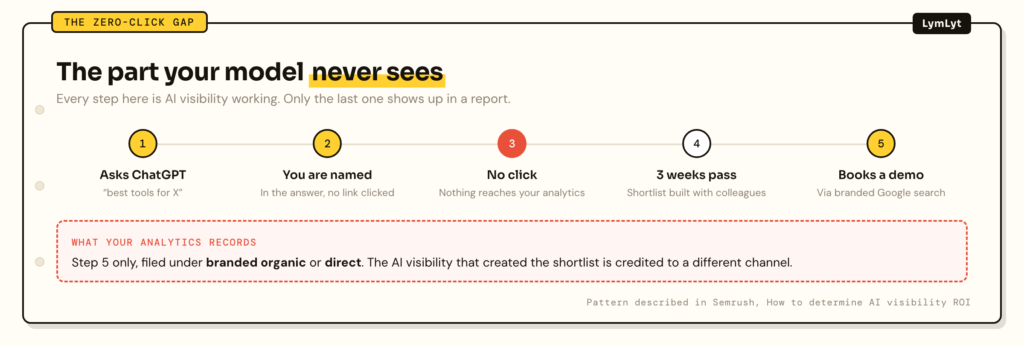
This is the bigger issue and it does not have a technical fix.
A buyer asks ChatGPT which tools solve their problem. Your product is named. They do not click. Three weeks later they run a shortlist with two colleagues, you are on it, and someone books a demo through a Google search for your brand name.
Every part of that is AI visibility working. None of it appears in an AI channel. The revenue lands in branded organic or direct.
Semrush’s own guidance says the same thing: most of this influence never produces a trackable click, and a buyer can form an opinion in an AI answer and convert weeks later through a different channel.
Which means the click-based model systematically undercounts the thing it is trying to measure, while looking precise to three decimal places.
3. The traffic that does click is not representative
AI assistants tend to send people who are already deep in a decision. They have described their problem, been given a shortlist, and clicked to verify.
That is why AI referral conversion rates look so high. It is not that AI traffic is magic. It is that the top of the funnel got absorbed into the chat window and never reached your site.
A rising AI conversion rate paired with falling organic sessions is not necessarily a win. It can mean your research-stage traffic disappeared and only the ready-to-buy remainder still clicks through. Your conversion rate goes up. Your pipeline does not.
If you report the conversion rate without the volume, you will report that as a success.
4. The lag is longer than your reporting cycle
Semrush’s own timeline for AI visibility work:
| Window | What moves |
|---|---|
| 0 to 30 days | Visibility and citations |
| 30 to 60 days | AI referral traffic and branded search |
| 60 to 90 days | Leads and pipeline |
| 90 to 180 days | Closed revenue |
Most teams are asked for an ROI number at day 45. At day 45 there is no revenue to divide by cost. Anything you produce is a projection.
What I report instead
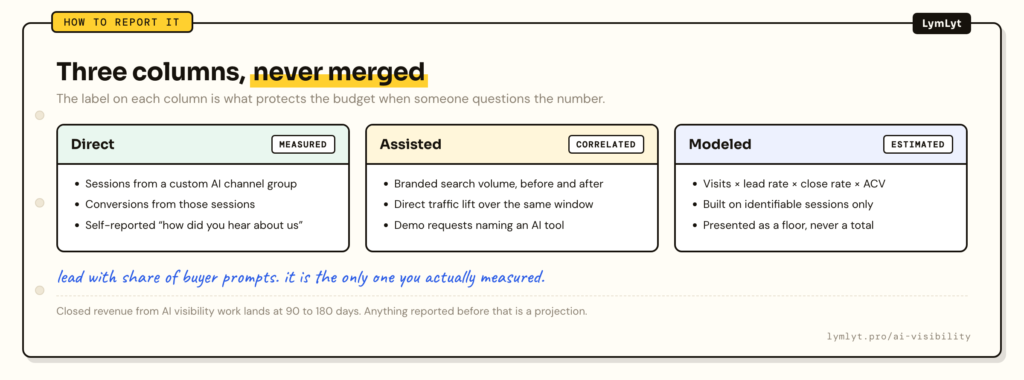
I still run the revenue model. I just do not lead with it, and I never present it as measured.
Three columns, always separated:
| Column | What goes in it | How I label it |
|---|---|---|
| Direct | Sessions and conversions from a properly configured AI channel group | Measured |
| Assisted | Branded search lift and direct traffic lift over the same period | Correlated |
| Modeled | The Semrush-style revenue calculation | Estimated |
The number I actually lead with is share of buyer prompts.
Share of buyer prompts
Pick the questions your buyers really ask when they are choosing a product in your category. Not keywords. Questions, in the words a person would type into a chat window.
For a B2B SaaS company that usually lands somewhere between 30 and 50 prompts across four groups:
| Prompt type | Example shape | Why it matters |
|---|---|---|
| Category | “best tools for X” | Do you exist in the consideration set |
| Competitor | “alternatives to [competitor]” | Are you offered as a swap |
| Problem | “how do I fix [problem]” | Are you present before a category is chosen |
| Qualification | “is [your product] good for [segment]” | Is what the model says about you accurate |
Then record, monthly, for each prompt:
- Are you mentioned
- Are you cited as a source with a link
- Which competitors appear alongside you
- Is what the model says about you correct
Those four are the difference between a mention and a citation, and they behave differently. We track them separately for every client.
This is not a perfect metric. It is a leading indicator, not revenue. But it has three properties the ROI number does not:
- It is directly measured. You ran the prompt. You saw the answer.
- It moves inside a reporting cycle. Citation changes show up in weeks.
- It is defensible. When a CFO asks where the number came from, the answer is a spreadsheet of prompts and screenshots, not a chain of five multiplied assumptions.
The related concepts here are share of model and citation share, if you want the definitions.
A fair way to model revenue anyway
You will still be asked for a money number. Here is how I build one without overclaiming.
Use your own funnel rates from your CRM. Use a deliberately conservative visit figure. Then show the range rather than a point estimate.
| Input | Where it comes from | Example |
|---|---|---|
| AI-attributed visits | Custom channel group, low estimate | 400 |
| Lead rate | Your CRM, last 12 months | [YOUR RATE] |
| Qualified rate | Your CRM | [YOUR RATE] |
| Close rate | Your CRM | [YOUR RATE] |
| ACV | Your CRM | [YOUR ACV] |
| Gross margin | Finance | [YOUR MARGIN] |
| Monthly cost | Tools + content + team time | [YOUR COST] |
Then present it as: “Using only the AI sessions we can positively identify, this program models to X. The identifiable sessions are a floor, not a total, because of the attribution gaps listed below. Actual influence is higher by an unknown amount.”
That sentence has done more to protect content budgets in my client conversations than any inflated multiple.
Fix your measurement before you argue about ROI
Only 14% of marketers plan to invest in analytics and measurement this year, against 49% investing in content creation. That is from Semrush’s survey of 481 marketers, which also found 45% cannot measure their visibility in AI answers at all and only 9% can measure everything they consider relevant.
The order is backwards. Measurement is cheap compared to content. Do it first.
A workable first month:
- Build a custom channel group in GA4 rather than relying on the default AI Assistant channel. Admin, then Data display, then Channel groups. Include Perplexity and the other sources Google leaves out.
- Check the Unassigned bucket for
chatgpt.com / (not set)and count what is hiding there. - Write your prompt set. 30 to 50 prompts, four categories above. This takes an afternoon.
- Run the prompt set and record the baseline before you change anything.
- Add a “how did you hear about us” field to your demo form. Self-reported attribution is imperfect and it is still the only signal that survives referrer stripping.
- Pull your branded search volume now, so you have a before number.
Our free AI visibility checklist covers the content and technical side of this. If you want tooling to run the prompt tracking for you, we compared the options in best AI visibility tracking tools.
What I would tell a CMO
If you are being asked to justify AI visibility spend right now, say three things.
One. The click-based ROI number is a floor, not a measurement. Show it, label it modeled, and show the gaps underneath it.
Two. Report share of buyer prompts as the primary metric this quarter. It is measured rather than inferred, and it moves fast enough to steer the work.
Three. Ask for two quarters. Closed revenue from this work shows up at 90 to 180 days. Anything reported before then is a projection, and a projection presented as a result is how content budgets get cut in the following year when the projection does not land.
The teams doing this well are not the ones with the best number. They are the ones whose numbers survive being questioned.
If you want help building the prompt set and the content that changes what those answers say, that is the AI visibility work we do. Pricing is public, and the complete guide to AI visibility for B2B SaaS covers the strategy end of it.
FAQ
Is AI visibility ROI just impossible to measure?
No. It is impossible to measure precisely with click attribution alone. You can measure prompt-level presence directly, and you can model revenue from the subset of traffic you can identify, as long as you label it as modeled.
Should I use the 23x conversion figure in my business case?
No. It is one company’s 30 days of data on a product with an unusually short buying cycle, and the author said as much in the post.
Does the GA4 AI Assistant channel fix attribution?
Partly. It captures sessions where the referrer is present and the source is on Google’s list. Perplexity, stripped referrers and AI Overviews are still missing. Build a custom channel group as well.
How many prompts should I track?
30 to 50 for most B2B SaaS companies. Fewer than 30 and you miss segments. More than 50 and nobody keeps it updated.
How long before AI visibility work shows up in revenue?
90 to 180 days for closed revenue, based on Semrush’s published timeline and consistent with what we see. Citations move much earlier, inside 30 days.
What if my AI conversion rate is rising but pipeline is flat?
Check your session volume. A rising conversion rate with falling sessions usually means research-stage visits moved into the chat window. That is a volume problem, not a conversion win.

Rashmita is content marketer with 8 years of experience building and growing SaaS brands. Now she tests various AI tools for marketers and shares her feedback on this blog, LinkedIn, Instagram, and YouTube.