How to Build an Ideal Customer Profile (ICP): 7 Data Points to Use
An ideal customer profile tells you which companies to chase and which to ignore. Most teams write one in a workshop, based on gut feel, and never look at it again. Then marketing targets one market, sales sells to another, and the product team builds for a third.
The cost of a weak ICP has gone up. In 6sense’s 2025 B2B Buyer Experience Study of nearly 4,000 buyers, buying groups filled four of their five shortlist spots on Day 1, and bought from their top-ranked vendor 77% of the time (CustomerThink). If you aren’t known to the right accounts before they start looking, you’re rarely in the race. That’s why the B2B buying journey starts before your marketing funnel does.
This guide shows how to build an ICP from evidence, not opinion. You’ll get the seven data points to collect, where to find each one, a one-page template and a simple way to score accounts. For a short definition first, see our ICP glossary entry.
Try our FREE AI visibility checklist
What is an ideal customer profile?
An ideal customer profile (ICP) describes the type of company that gets the most value from your product and gives you the most value back. It’s about the account, not the person.
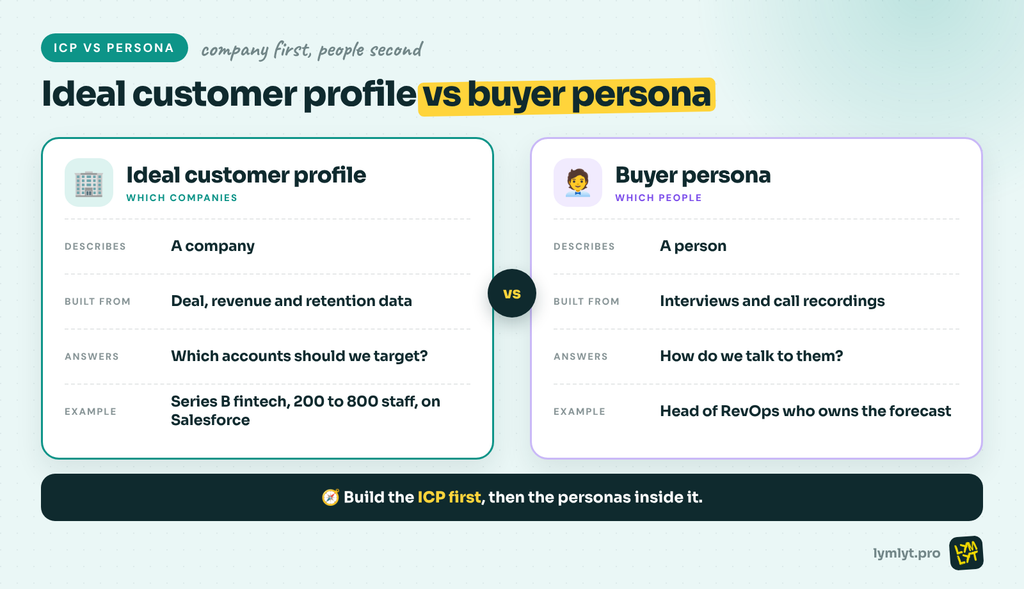
A buyer persona is different. It describes the people inside that account: their role, goals and objections. You need both, but you build the ICP first. Personas without an ICP give you well-described people at companies that will never buy.
| Ideal customer profile | Buyer persona | |
|---|---|---|
| Describes | A company | A person |
| Built from | Deal, revenue and retention data | Interviews and call recordings |
| Answers | “Which accounts should we target?” | “How do we talk to them?” |
| Example | Series B fintech, 200 to 800 staff, on Salesforce | Head of RevOps who owns the forecast |
| Used by | Sales, marketing, product, leadership | Marketing, content, sales enablement |
Step 2: Collect the 7 ideal customer profile data points
With your best-customer list ready, collect the same seven data points for every account. Put them in one spreadsheet, one row per account. The patterns usually show up fast.
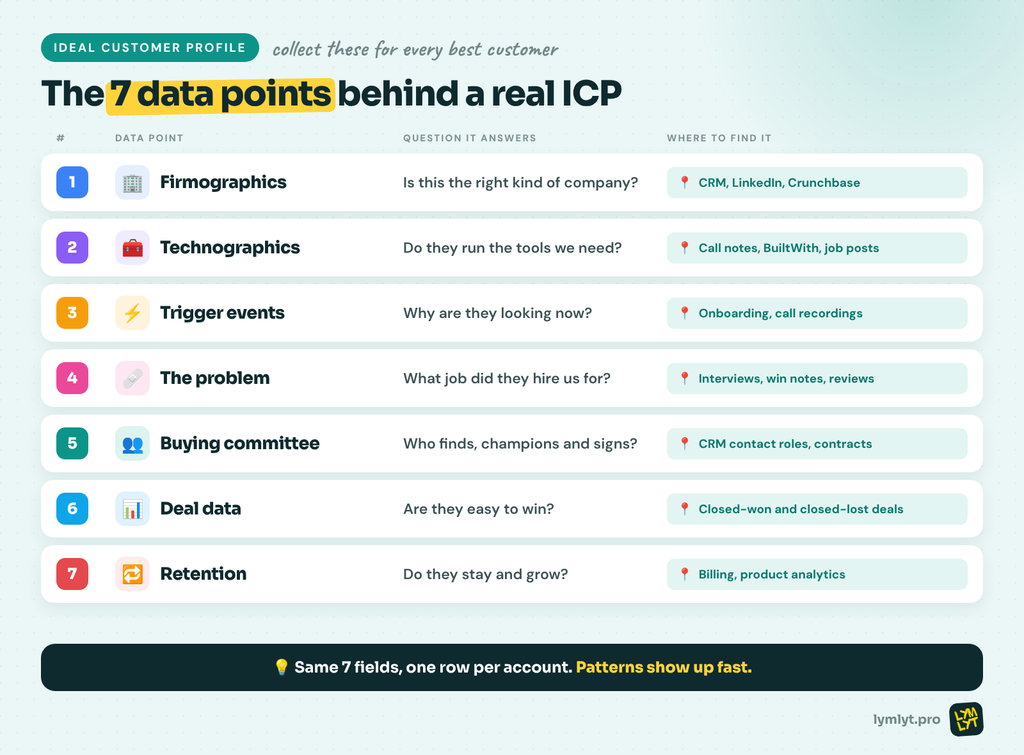
1. Firmographics
These are the basic facts about the company. They’re the easiest to collect, and the easiest to overweight.
- Capture: industry, employee count, revenue band, region, funding stage, business model (B2B, B2C, marketplace).
- Where to find it: your CRM, LinkedIn company pages, Crunchbase.
- Watch for: ranges, not single numbers. “100 to 500 employees” is useful. “Mid-market” is not.
2. Technographics
The tools a company already uses tell you a lot about budget, maturity and fit.
- Capture: the CRM, data warehouse, marketing automation and any tools you integrate with or replace.
- Where to find it: sales call notes, BuiltWith or Wappalyzer for web tools, job posts that name the stack.
- Watch for: “must have” tools. If 80% of your best customers run HubSpot, that’s a filter, not a detail.
3. Trigger events
A trigger is the thing that happened right before the company started looking. Triggers tell you when to reach out, not only who.
- Capture: new funding, a new leader in the buying role, a migration, a compliance deadline, rapid hiring, a failed tool.
- Where to find it: ask in onboarding (“What made you look now?”), discovery call recordings, LinkedIn job changes.
- Watch for: the trigger that shows up again and again. That’s your best timing signal.
4. The problem, in their words
This is the job your product was hired to do. Capture it in the customer’s exact words, not your product language.
- Capture: the problem, what they tried before, what it was costing them.
- Where to find it: customer interviews, win notes, reviews. Our guide to running a case study interview has questions that get past polite answers.
- Watch for: phrases repeated across accounts. They become your headlines and ad copy.
5. The buying committee
List who was involved in each deal: who found you, who championed you, who signed and who almost blocked it.
- Capture: champion’s role, economic buyer, technical reviewer, finance and procurement involvement.
- Where to find it: CRM contact roles, call attendees, the signature on the contract.
- Watch for: finance. In G2’s 2026 Buyer Behavior Report, finance involvement in software decisions rose from 31% to 46% in one year (G2 via Webull). Our guide to the B2B buying committee breaks down what each role needs.
6. Deal data
This is where gut feel meets reality. Compare deal metrics by segment to see which accounts are actually easy to win.
- Capture: win rate, sales cycle length, average contract value, discount given, number of meetings to close.
- Where to find it: your CRM, using closed-won and closed-lost deals together.
- Watch for: segments with high win rates but small deals, and the reverse. Your ICP sits where both are healthy.
7. Retention and expansion
A customer who closes fast and churns in eight months is not ideal. Retention data stops you from building an ICP around easy wins.
- Capture: gross and net revenue retention, time to first value, product usage, expansion revenue.
- Where to find it: billing system, product analytics, customer success notes.
- Watch for: the segment with the highest net retention. It often differs from the one with the highest win rate.
Step 3: Spot the patterns
Once your spreadsheet is filled in, look for traits shared by most of your best accounts. A simple rule: if a trait shows up in 70% or more of them, it belongs in the ICP. If it shows up in under 30%, leave it out.
Then do the same exercise for your worst accounts: fast churners, heavy discounters, stalled deals. The traits they share become your disqualifiers.
Step 4: Write a one-page ICP
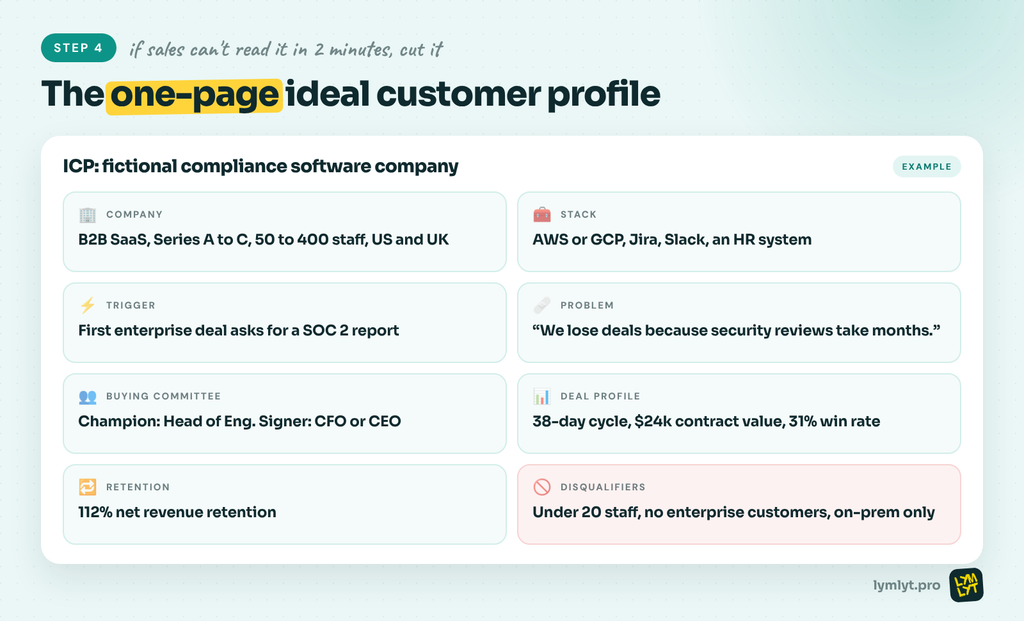
Keep it to one page. If sales can’t read it in two minutes, they won’t use it. Here’s a filled-in example for a fictional compliance software company.
| Section | Example |
|---|---|
| Company | B2B SaaS, Series A to C, 50 to 400 employees, US and UK |
| Stack | AWS or GCP, Jira, Slack, an HR system such as Rippling |
| Trigger | First enterprise deal asks for a SOC 2 report |
| Problem | “We’re losing deals because security reviews take months.” |
| Buying committee | Champion: Head of Engineering. Signer: CFO or CEO. Reviewer: security lead |
| Deal profile | 38-day sales cycle, average contract value of $24k, win rate of 31% |
| Retention | 112% net revenue retention; expands when they add ISO 27001 |
| Disqualifiers | Under 20 staff, no enterprise customers yet, wants on-premise only |
Step 5: Add an anti-ICP
An anti-ICP lists the companies you should not sell to, even when they want to buy. It saves sales time and protects your retention numbers.
Common disqualifiers:
- Too small to have the problem yet
- Missing a required tool or integration
- Needs a feature you don’t plan to build
- Buys only through a long RFP you rarely win
- Historically churns within a year
Write the anti-ICP down and share it with sales. A disqualifier only works if people use it to walk away.
Step 6: Score and tier your accounts
Turn the ICP into a score so sales and marketing can rank accounts the same way. Give each trait points, then group accounts into tiers.
| Trait | Points |
|---|---|
| Industry and size match | 25 |
| Uses a must-have tool | 20 |
| Recent trigger event | 20 |
| Problem confirmed in research or a call | 20 |
| Right champion role is reachable | 15 |
| Total | 100 |
| Tier | Score | What to do |
|---|---|---|
| Tier A | 75 to 100 | One-to-one outreach, custom content, senior sales time |
| Tier B | 50 to 74 | Targeted campaigns and sequences by segment |
| Tier C | Under 50 | Nurture only, or skip |
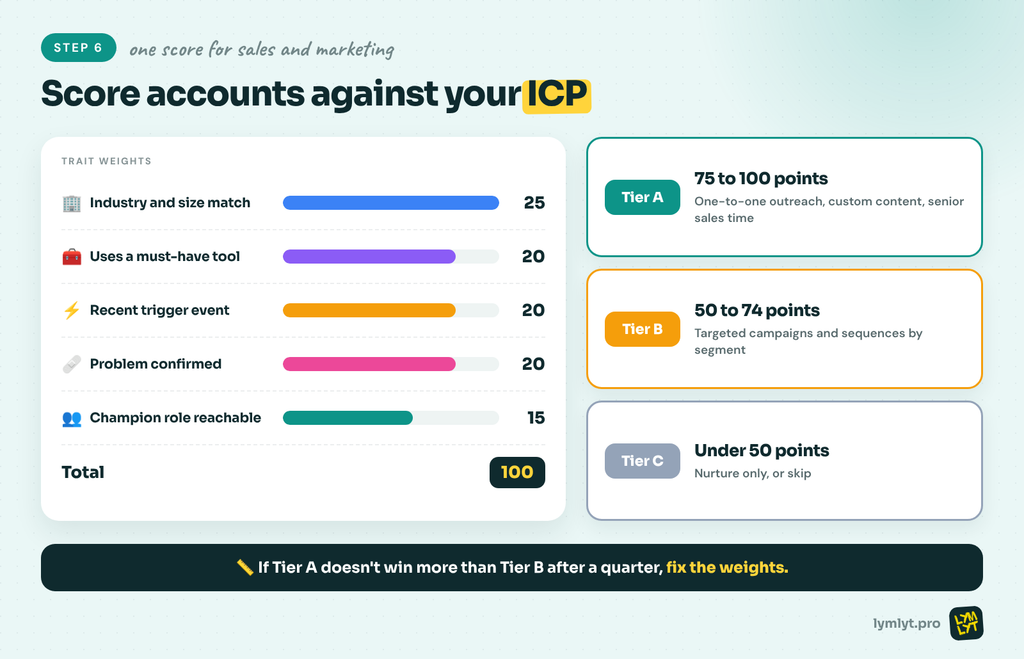
Check the model after one quarter. If Tier A accounts don’t win more often than Tier B, your weights are wrong.
Step 7: Put your ICP to work
An ICP that lives in a slide deck changes nothing. Use it everywhere:
- Content: write for the problem and trigger, in the customer’s words. Our post on why your ICP doesn’t read your blog explains what that looks like in practice.
- Positioning: use the ICP to decide what you claim and who you claim it for. See our guide to B2B positioning, then turn it into a messaging framework.
- Website: tailor pages by segment with one of the best website personalization tools.
- Lead scoring: score fit, not only activity. A flood of off-ICP leads is why more MQLs can still mean less pipeline.
- Research: keep validating with the best audience research tools.
Common ideal customer profile mistakes
- Describing everyone. “B2B companies with 10 to 10,000 employees” isn’t a profile.
- Using only firmographics. Size and industry don’t explain why one company buys and its twin doesn’t.
- Ignoring churn. Building around fast closers who leave in a year.
- Writing it once. Markets move. A two-year-old ICP is a guess.
- Keeping it in marketing. If sales and product don’t agree with it, it isn’t your ICP.
How often to update your ICP
Review it every quarter with sales, marketing and customer success in the room. Do a full rebuild once a year, or sooner if any of these happen:
- You launch a new product or enter a new market
- Win rates drop for two quarters in a row
- A new segment starts closing faster than your core one
- Churn rises in a segment you thought was ideal
The bottom line
A useful ideal customer profile is built from your best customers, not your hopes. Collect seven data points (firmographics, technographics, triggers, the problem, the buying committee, deal data and retention), find what your best accounts share, and write it on one page. Then add disqualifiers, score your accounts and use the profile in every campaign.
If you want content that speaks to that ICP, our team writes landing pages, case studies and blog content built around your best customers’ own words.

Jay is the co-founder of LymLyt and an AI partnership consultant helping B2B SaaS companies grow through content strategy, SEO, and AI integration. He writes about content marketing, what makes B2B content convert, and how SaaS teams can build content systems that drive real pipeline.